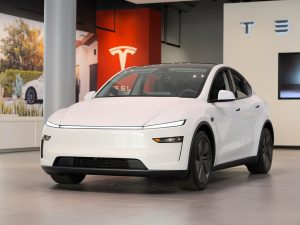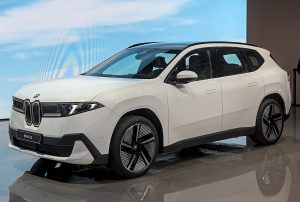
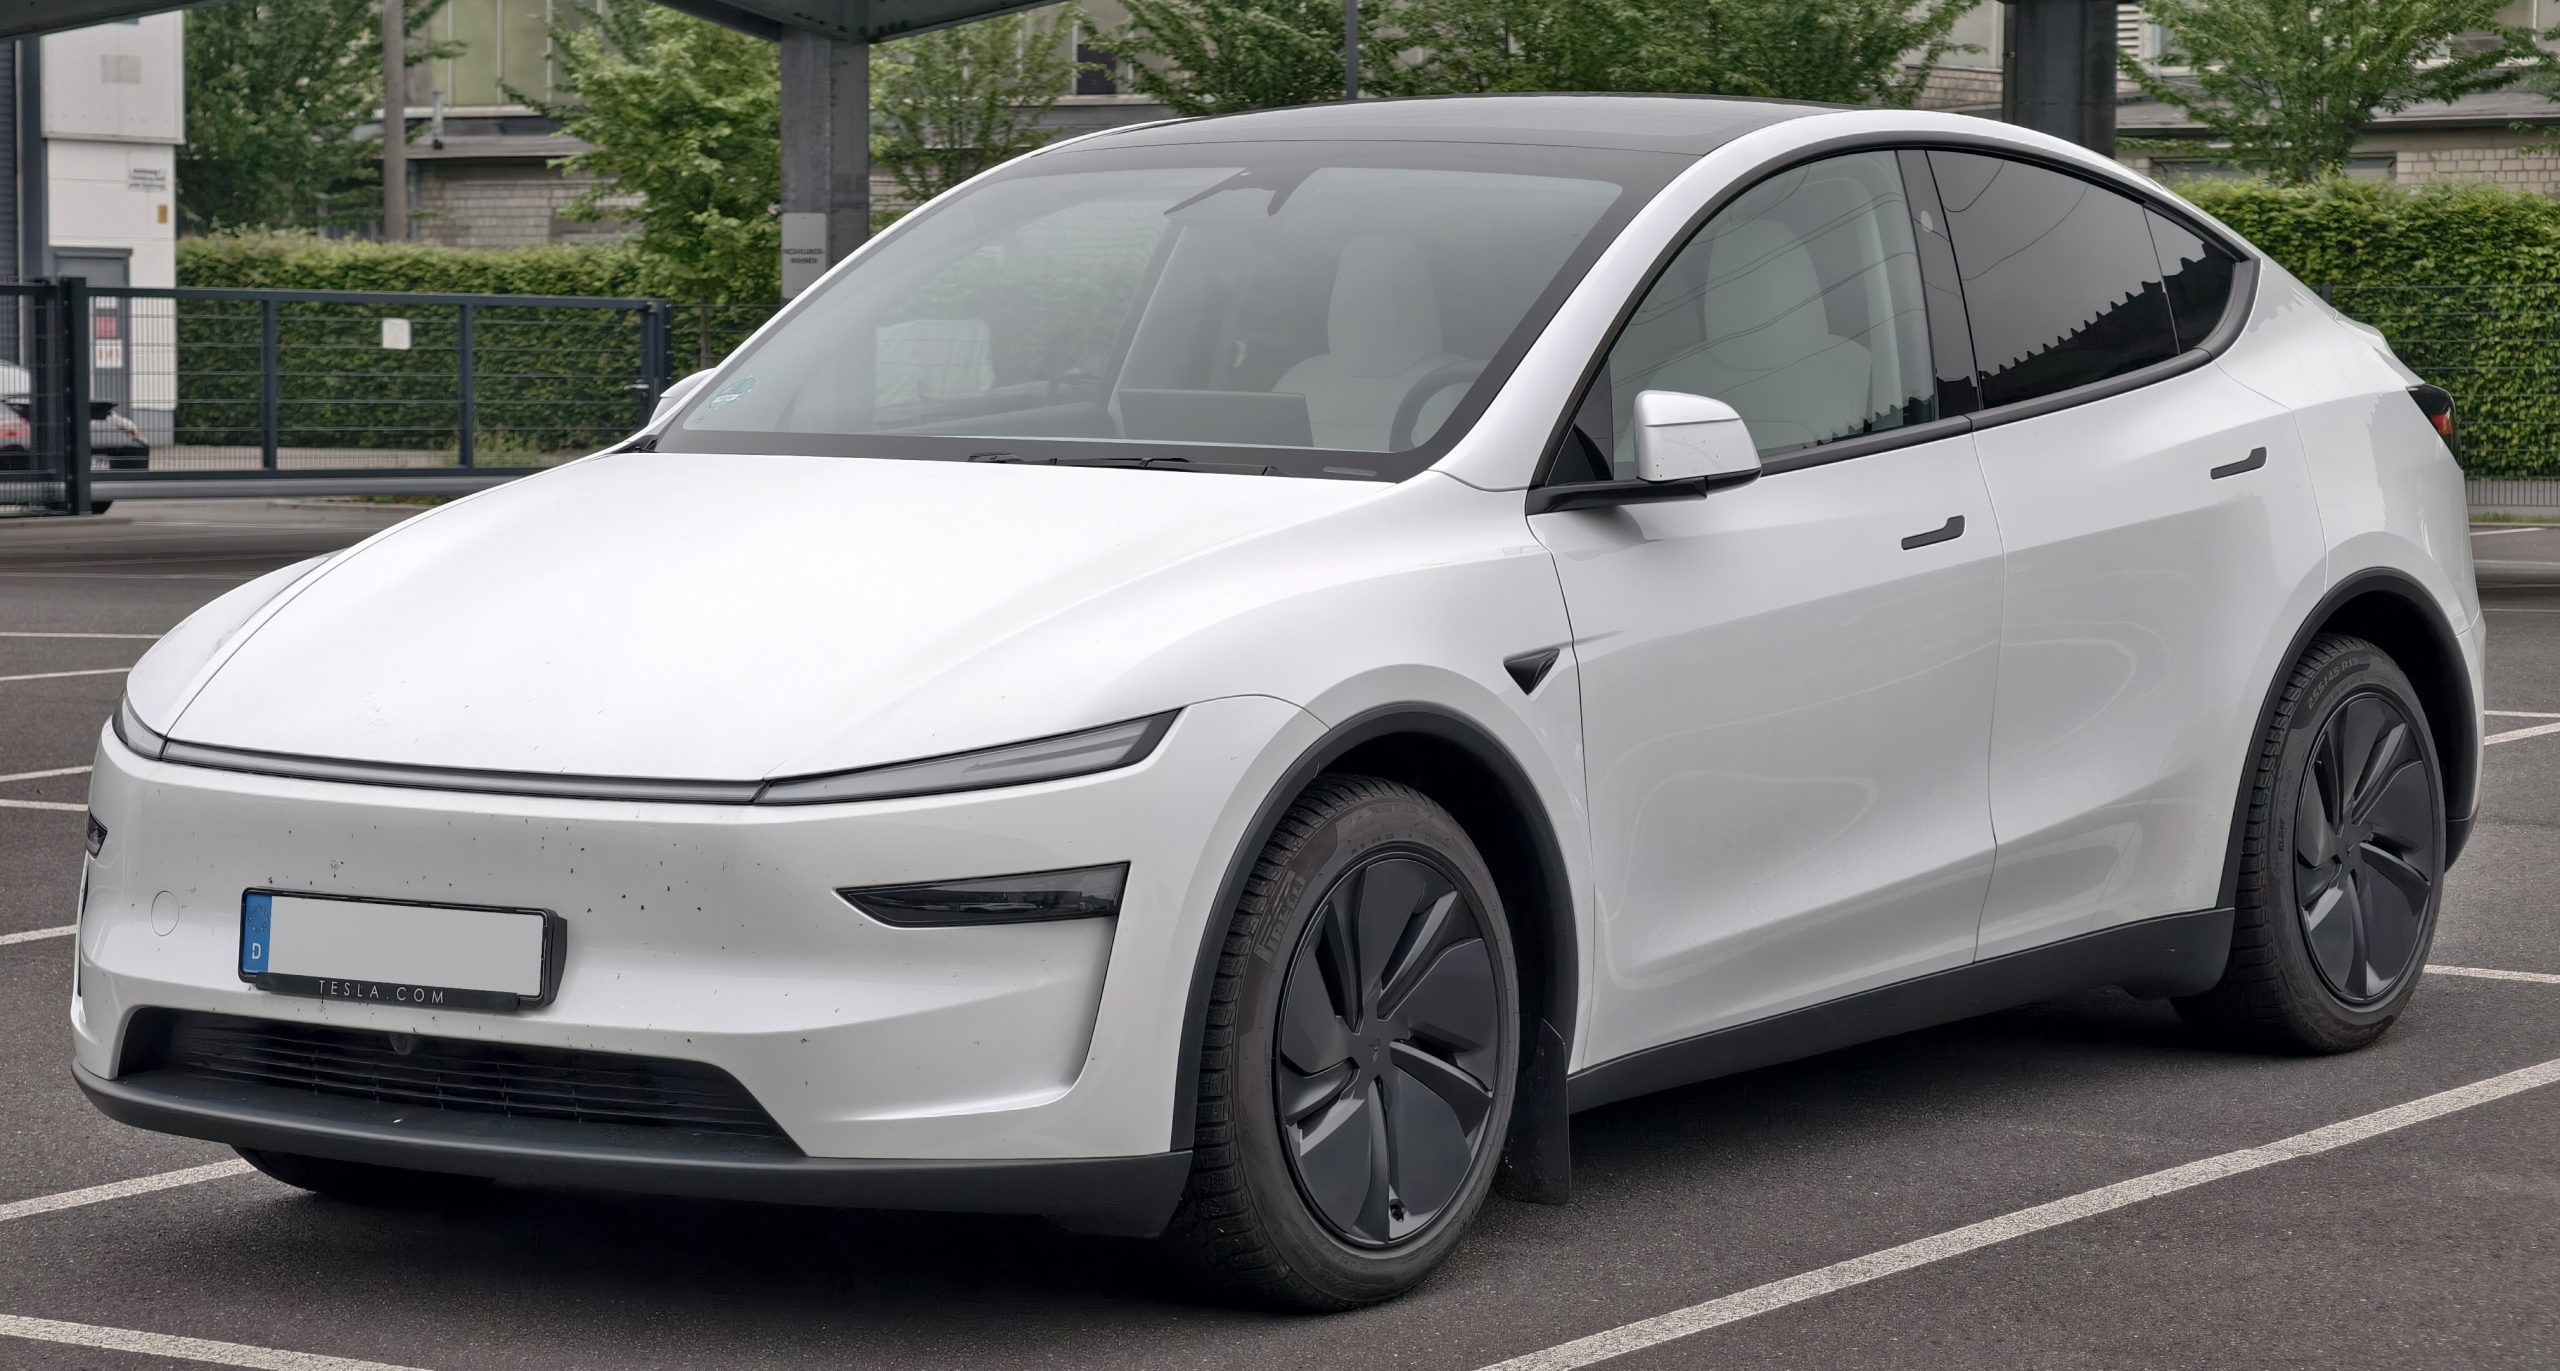
The Rivian R2 and Tesla Model Y Performance carry identical EPA efficiency ratings on paper, yet independent road testing this week found the Rivian consuming substantially more energy at every speed tested. The gap raises practical questions for buyers comparing two of the most closely watched electric SUVs in the US EV market — and it highlights how label figures can diverge from what drivers actually see on the highway.
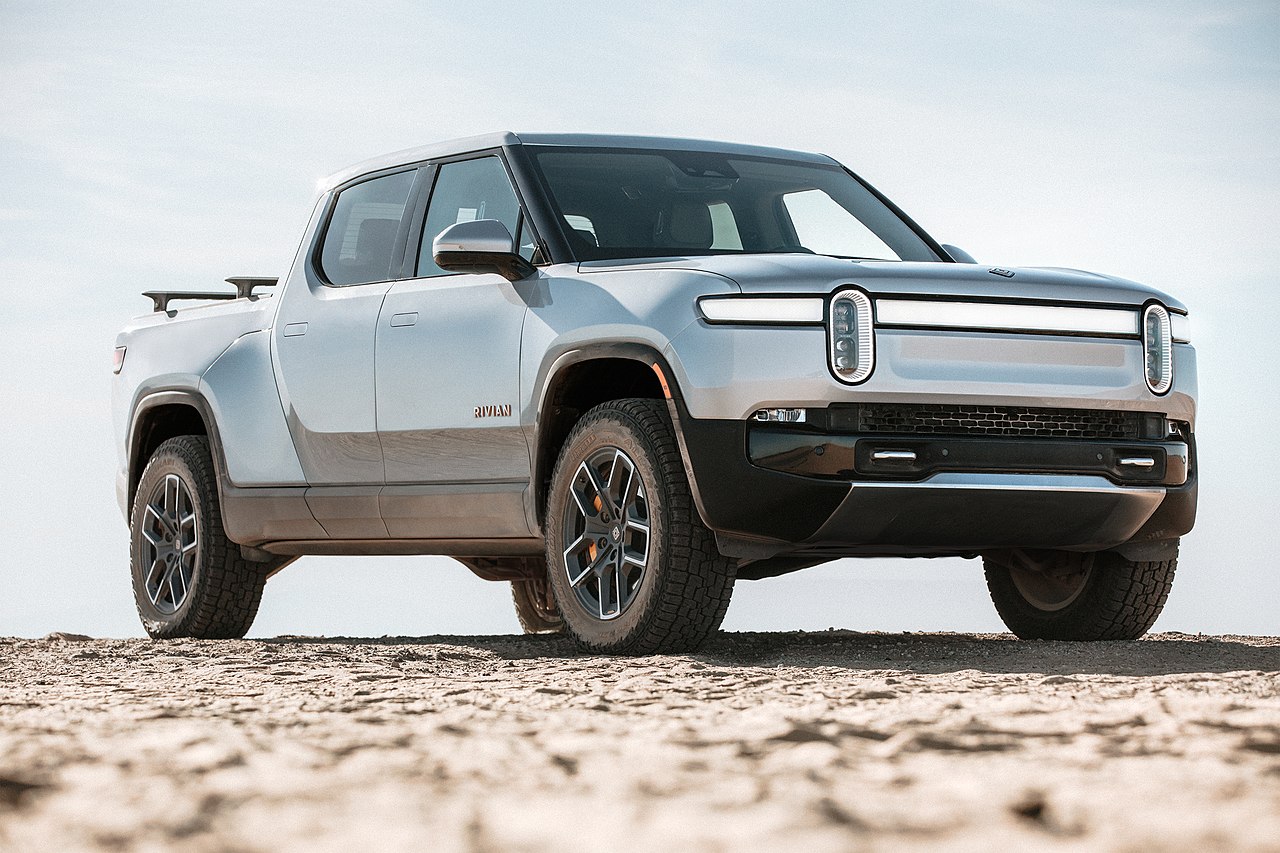
According to coverage from Electrek and InsideEVs, Out of Spec Reviews ran a Rivian R2 Performance and a Tesla Model Y Performance on the same roads on the same afternoon. At 50 mph, the R2 used about 18% more energy than the Model Y; at 60 mph the gap widened to roughly 26%. At 70 mph the Rivian still consumed around 20% more, though the testers noted traffic and nearby trucks may have given its upright body a slight aerodynamic assist.
On EPA labels, both vehicles are rated at 32 kWh per 100 miles combined, with the R2 edging the Model Y in city MPGe and the Model Y winning on the highway cycle. The R2 also claims a longer EPA range — 330 miles versus 306 for the Model Y Performance. Real-world testing flipped that narrative: after a controlled charging session, the R2 covered 92.8 miles at 2.2 mi/kWh, while the Model Y, tested two days earlier, managed roughly 103 miles at 3.3 mi/kWh on less added energy.
Why identical labels can tell different stories
InsideEVs noted several caveats. The comparison relied on each vehicle’s onboard energy consumption readouts rather than wall-metered charging data, and most test segments were relatively short. Even so, the testers described the matchup as partly “apples-to-oranges,” suggesting the two SUVs may have been certified under different EPA test procedures — the R2 reportedly completed the full five-cycle suite while the Model Y figure may reflect a shorter test path with EPA correction factors applied.
Electrek highlighted a further wrinkle: EPA kWh/100-mile figures are measured at the wall and include charging losses, whereas Out of Spec tracked energy leaving the battery. Backing out that math, EPA data effectively implies the R2 is slightly more efficient from the pack than the Model Y — a conclusion the road test directly contradicted.
Where the R2 fights back: charging speed
Efficiency is only half the road-trip equation. At an IONNA Rechargery station in Wilson, North Carolina, the R2 held a flat 600 amps — the limit of the Alpitronic hardware — from plug-in through 32% state of charge, peaking near 229 kW. In 15 minutes it added 48.3 kWh at a 193 kW average, climbing from 10% to 59% SOC. InsideEVs reported the R2 was still pulling 165 kW at 50% SOC, well above the sub-100 kW figures the Model Y Performance typically shows at similar levels.
For buyers weighing a Rivian against a Tesla in the electric SUV segment, the trade-off is clear: the R2 rewards drivers who can access high-amperage DC fast chargers and value quicker stop times, while the Model Y remains the better long-distance cruiser if minimizing energy use matters more than peak charging throughput.
Neither manufacturer has publicly responded to this week’s test results. Until broader independent data accumulates, shoppers should treat EPA range and efficiency figures as a starting point — not a guarantee of how these two vehicles will compare on their own routes.
Sources: Electrek and InsideEVs (27 July 2026), reporting on Out of Spec Reviews testing of the Rivian R2 Performance and Tesla Model Y Performance.